Introduction
One of the most basic algorithms in statistics and machine learning is linear regression. It is widely used due to its simplicity, interpretability, and efficiency in modeling the relationship between a dependent variable and one or more independent variables. This comprehensive guide aims to provide a detailed understanding of what linear regression is, explain its key assumptions, explore various applications, and include practical coding examples to help you implement linear regression models.
What is Linear Regression in Machine Learning?
An approach for supervised learning called linear regression is used to forecast a continuous target variable using one or more input features. The primary goal of linear regression is to establish a linear relationship between the input variables (independent variables) and the target variable (dependent variable). This relationship is represented by a linear equation, typically of the form:
Assumptions of Linear Regression
For linear regression to provide reliable predictions, certain assumptions need to be met. These assumptions ensure that the model is valid and the predictions are accurate. Basic principles of linear regression include:
- Linearity: The dependent variable and the independent variable have a linear relationship. This indicates that modifications to the independent variable cause corresponding modifications to the dependent variable. This assumption can be checked by plotting the residuals (errors) against the predicted values and looking for patterns.
- Independence: There is no correlation between the observations. This indicates that one observation’s value is independent of another observation’s value. Independence can be ensured by proper data collection and experimental design.
- Homoscedasticity: The residuals (errors) have constant variance at every level of the independent variables. This means that the spread of the residuals is consistent across all levels of the independent variables. Homoscedasticity can be checked by plotting the residuals against the predicted values and looking for a constant spread.
- Normality: The residuals of the machine learning model are normally distributed. This means that the errors are symmetrically distributed around zero. Normality can be checked using a Q-Q plot or by conducting statistical tests like the Shapiro-Wilk test.
- No Multicollinearity: The independent variables in the datasets are not highly correlated with each other. High multicollinearity can make it difficult to estimate the coefficients accurately and interpret their effects. Multicollinearity of the variables of datasets can be detected using the Variance Inflation Factor (VIF).
Applications of Linear Regression
Linear regression is widely used across various fields due to its simplicity and interpretability. Here are some common applications of linear regression:
- Predictive Modeling: Linear regression is used to estimate future values based on historical data. For example, sales forecasting involves predicting future sales based on past sales data and other factors like marketing spend, seasonality, and economic conditions.
- Risk Management: In finance and insurance, linear regression is used to assess risk factors. For instance, it can help in predicting credit risk by analyzing the relationship between a borrower’s financial history and the likelihood of defaulting on a loan.
- Health and Medicine: Linear regression is used to predict health outcomes based on patient data. For example, it can be used to predict a patient’s blood pressure based on age, weight, and lifestyle factors.
- Marketing Analytics: Linear regression helps analyze the impact of marketing strategies on sales performance. For example, it can be used to determine the effect of advertising spend on sales revenue.
- Social Sciences: Linear regression is used to study relationships between variables in fields like psychology, sociology, and economics. For example, it can be used to analyze the relationship between education level and income
Practical Examples for Linear Regression
Let’s dive into some practical coding examples to illustrate how linear regression can be implemented using Python and popular libraries like Scikit-Learn.
Example 1: Simple Linear Regression
import numpy as np
import matplotlib.pyplot as plt
from sklearn.model_selection import train_test_split
from sklearn.linear_model import LinearRegression
from sklearn.metrics import mean_squared_error, r2_score

# Sample data
x = np.array([1, 2, 3, 4, 5, 6, 7, 8, 9, 10]).reshape(-1, 1)
y = np.array([15000, 18000, 22000, 25000, 27000, 30000, 33000, 36000, 40000, 45000])

# Spliting the dataset into training set and testing set
x_train, x_test, y_train, y_test = train_test_split(x, y, test_size = 0.2, random_state = 42)

# Creating and training the linear regression model
model = LinearRegression()
model.fit(x_train, y_train)

# Make predictions
y_pred = model.predict(x_test)

# Evaluate the model
mse = mean_squared_error(y_test, y_pred)
r2 = r2_score(y_test, y_pred)

print("Mean Squared Error:", mse)
print("R-squared:", r2)

# Plot the results
plt.scatter(x, y, color='blue', label='Actual')
plt.plot(x, model.predict(x), color='red', label='Predicted')
plt.xlabel('Years of Experience')
plt.ylabel('Salary')
plt.title('Simple Linear Regression')
plt.legend()
plt.show()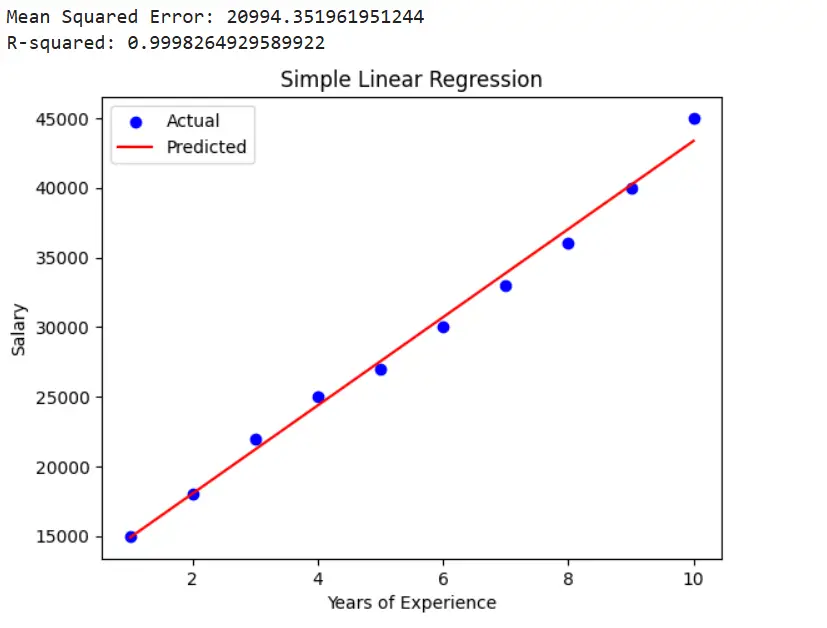
In this example, we created a simple linear regression model to predict a person’s salary based on their years of experience. We split the data into training and testing sets, trained the model, made predictions, and evaluated the model using mean squared error (MSE) and R-squared (R²). The results were then plotted to visualize the relationship between the actual and predicted values.
Example 2: Multiple Linear Regression
In this example, we will use a multiple linear regression model to predict a person’s salary based on their years of experience and education level.
import numpy as np
import matplotlib.pyplot as plt
from sklearn.model_selection import train_test_split
from sklearn.linear_model import LinearRegression
from sklearn.metrics import mean_squared_error, r2_score

# Sample data
x = np.array([1, 2, 3, 4, 5, 6, 7, 8, 9, 10]).reshape(-1, 1)
y = np.array([15000, 18000, 22000, 25000, 27000, 30000, 33000, 36000, 40000, 45000])

# Spliting the dataset into training set and testing set
x_train, x_test, y_train, y_test = train_test_split(x, y, test_size = 0.2, random_state = 42)

# Creating and training the linear regression model
model = LinearRegression()
model.fit(x_train, y_train)

# Make predictions
y_pred = model.predict(x_test)

# Evaluate the model
mse = mean_squared_error(y_test, y_pred)
r2 = r2_score(y_test, y_pred)

print("Mean Squared Error:", mse)
print("R-squared:", r2)

# Plot the results
plt.scatter(x, y, color='blue', label='Actual')
plt.plot(x, model.predict(x), color='red', label='Predicted')
plt.xlabel('Years of Experience')
plt.ylabel('Salary')
plt.title('Simple Linear Regression')
plt.legend()
plt.show()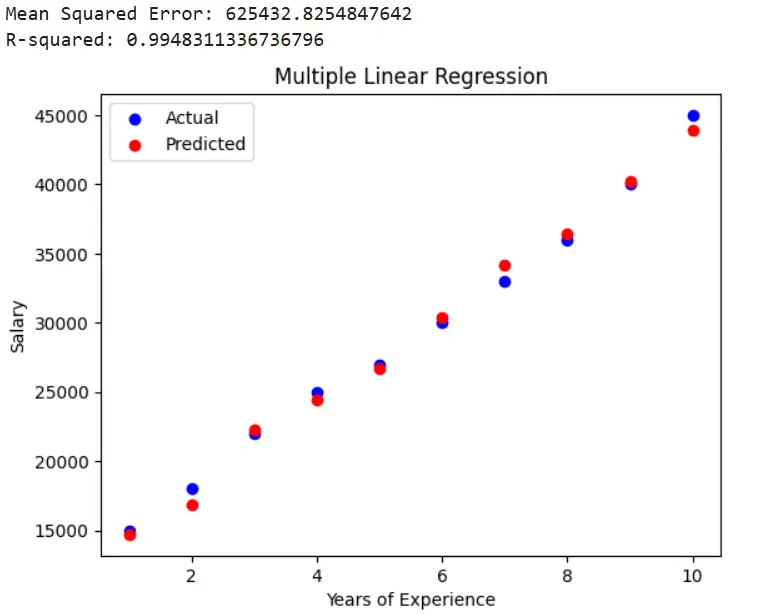
In this example, we created a multiple linear regression model to predict a person’s salary based on their years of experience and education level. Similar to the simple linear regression example, we split the data, trained the model, made predictions, and evaluated the model. The results were plotted to visualize the relationship between the actual and predicted values.
Conclusion
Linear regression is a powerful and versatile algorithm that forms the basis of many predictive modeling tasks. Understanding its assumptions and applications is crucial for anyone involved in data analysis and machine learning. By ensuring that the assumptions are met, practitioners can leverage linear regression to make accurate and reliable predictions in various fields.
Call to Action
If you found this deep dive into linear regression insightful, subscribe to our newsletter for more in-depth articles on machine learning algorithms and their applications. Don’t forget to share this post with your network to spread the knowledge!
Thanks for reading!
If you enjoyed this article and would like to receive notifications for my future posts, consider subscribing . By subscribing, you’ll stay updated on the latest insights, tutorials, and tips in the world of data science.
Additionally, I would love to hear your thoughts and suggestions. Please leave a comment with your feedback or any topics you’d like me to cover in upcoming blogs. Your engagement means a lot to me, and I look forward to sharing more valuable content with you.
Subscribe and Follow for More
